First Continuous Variables Analysis
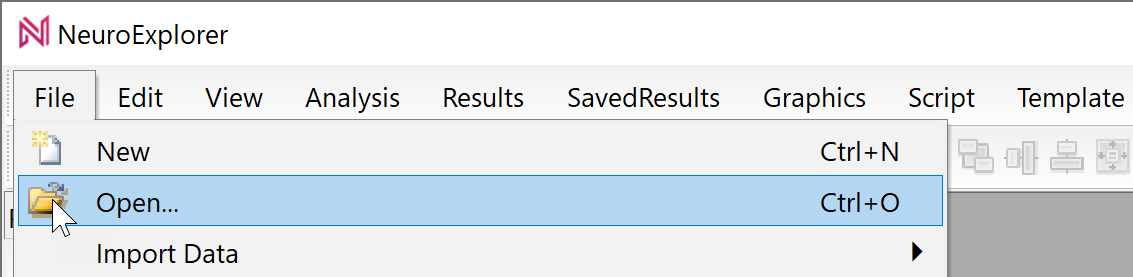
Select File | Open menu command:
Select TestDataFile5.nex file and click OK in the Open dialog. NeuroExplorer will load the test data file.
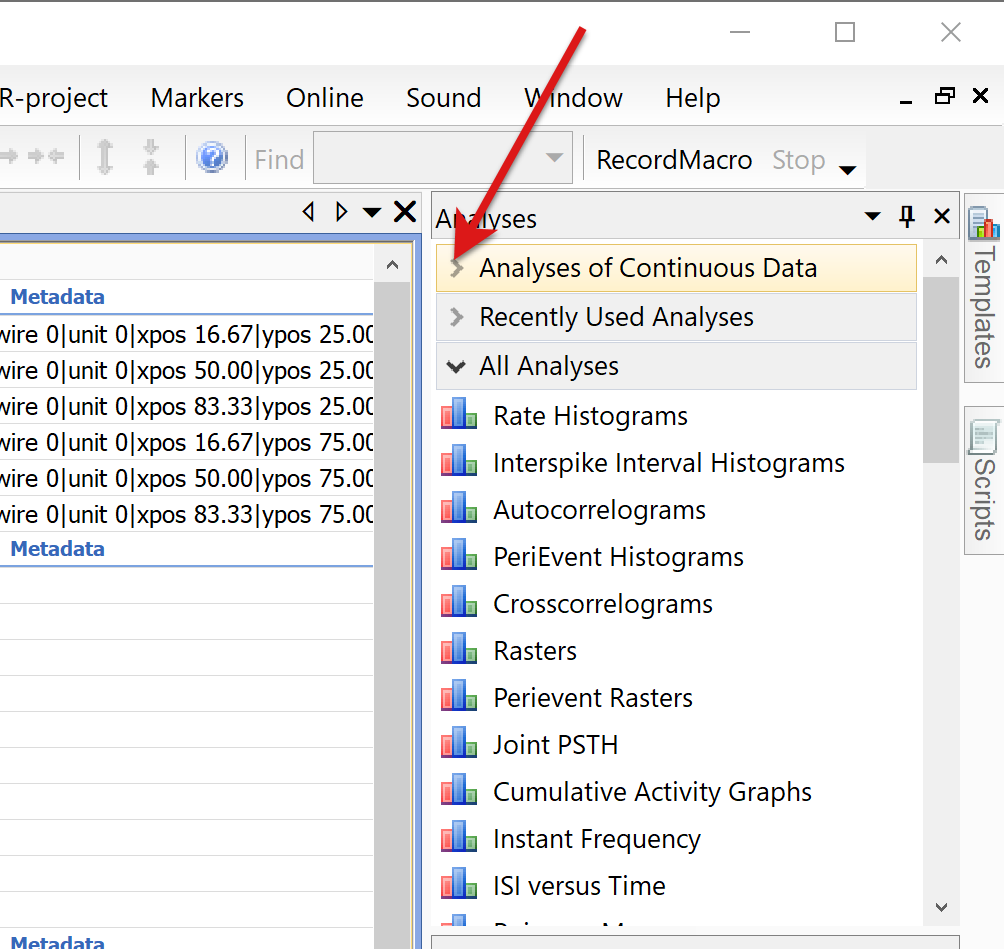
Open Analyses of Continuous Data folder by clicking the > icon at the top of the Analyses panel:
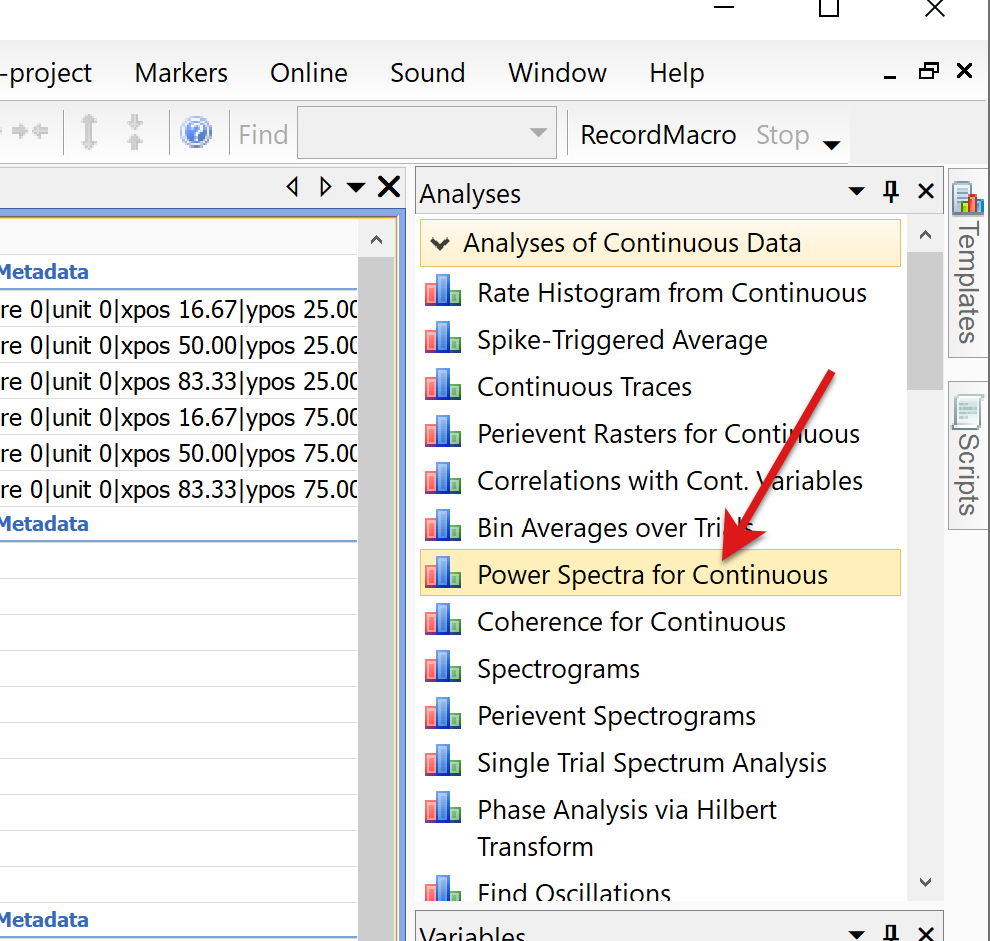
Select analysis type by clicking the Power Spectra for Continuous line in the Analyses panel:
NeuroExplorer will show the following message box:
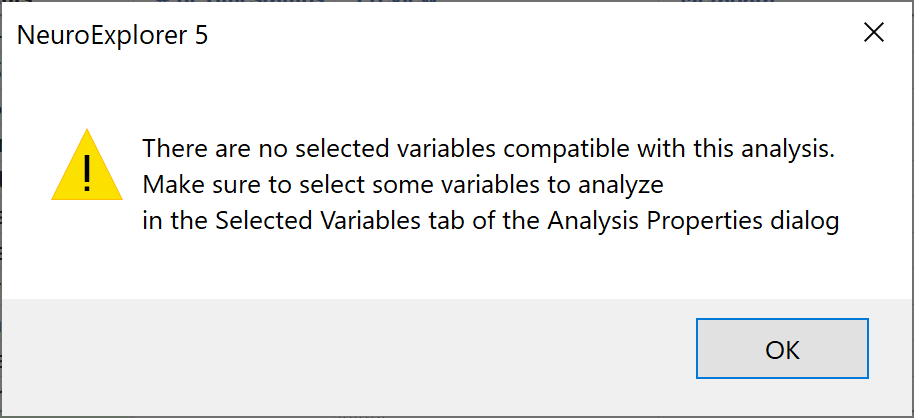
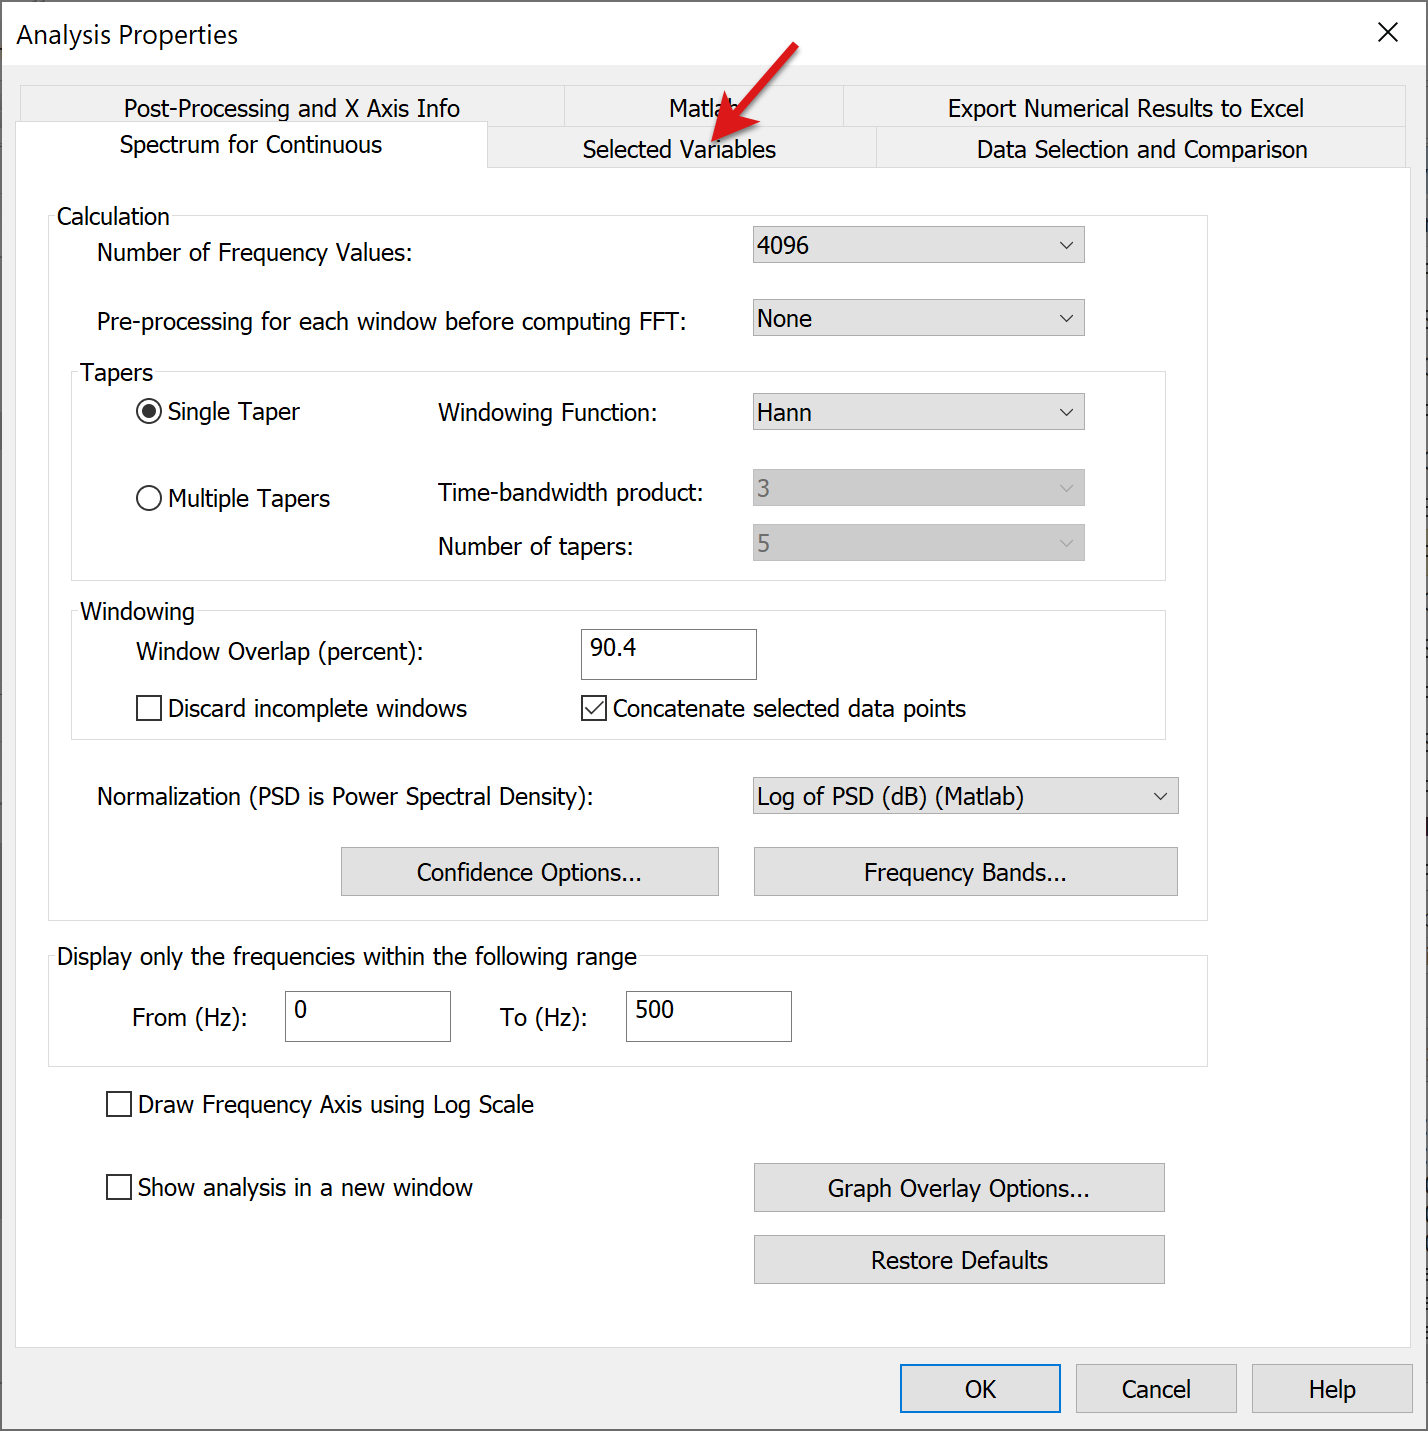
Close the message box. NeuroExplorer will open Analysis Properties dialog. Click on Selected Variables tab:
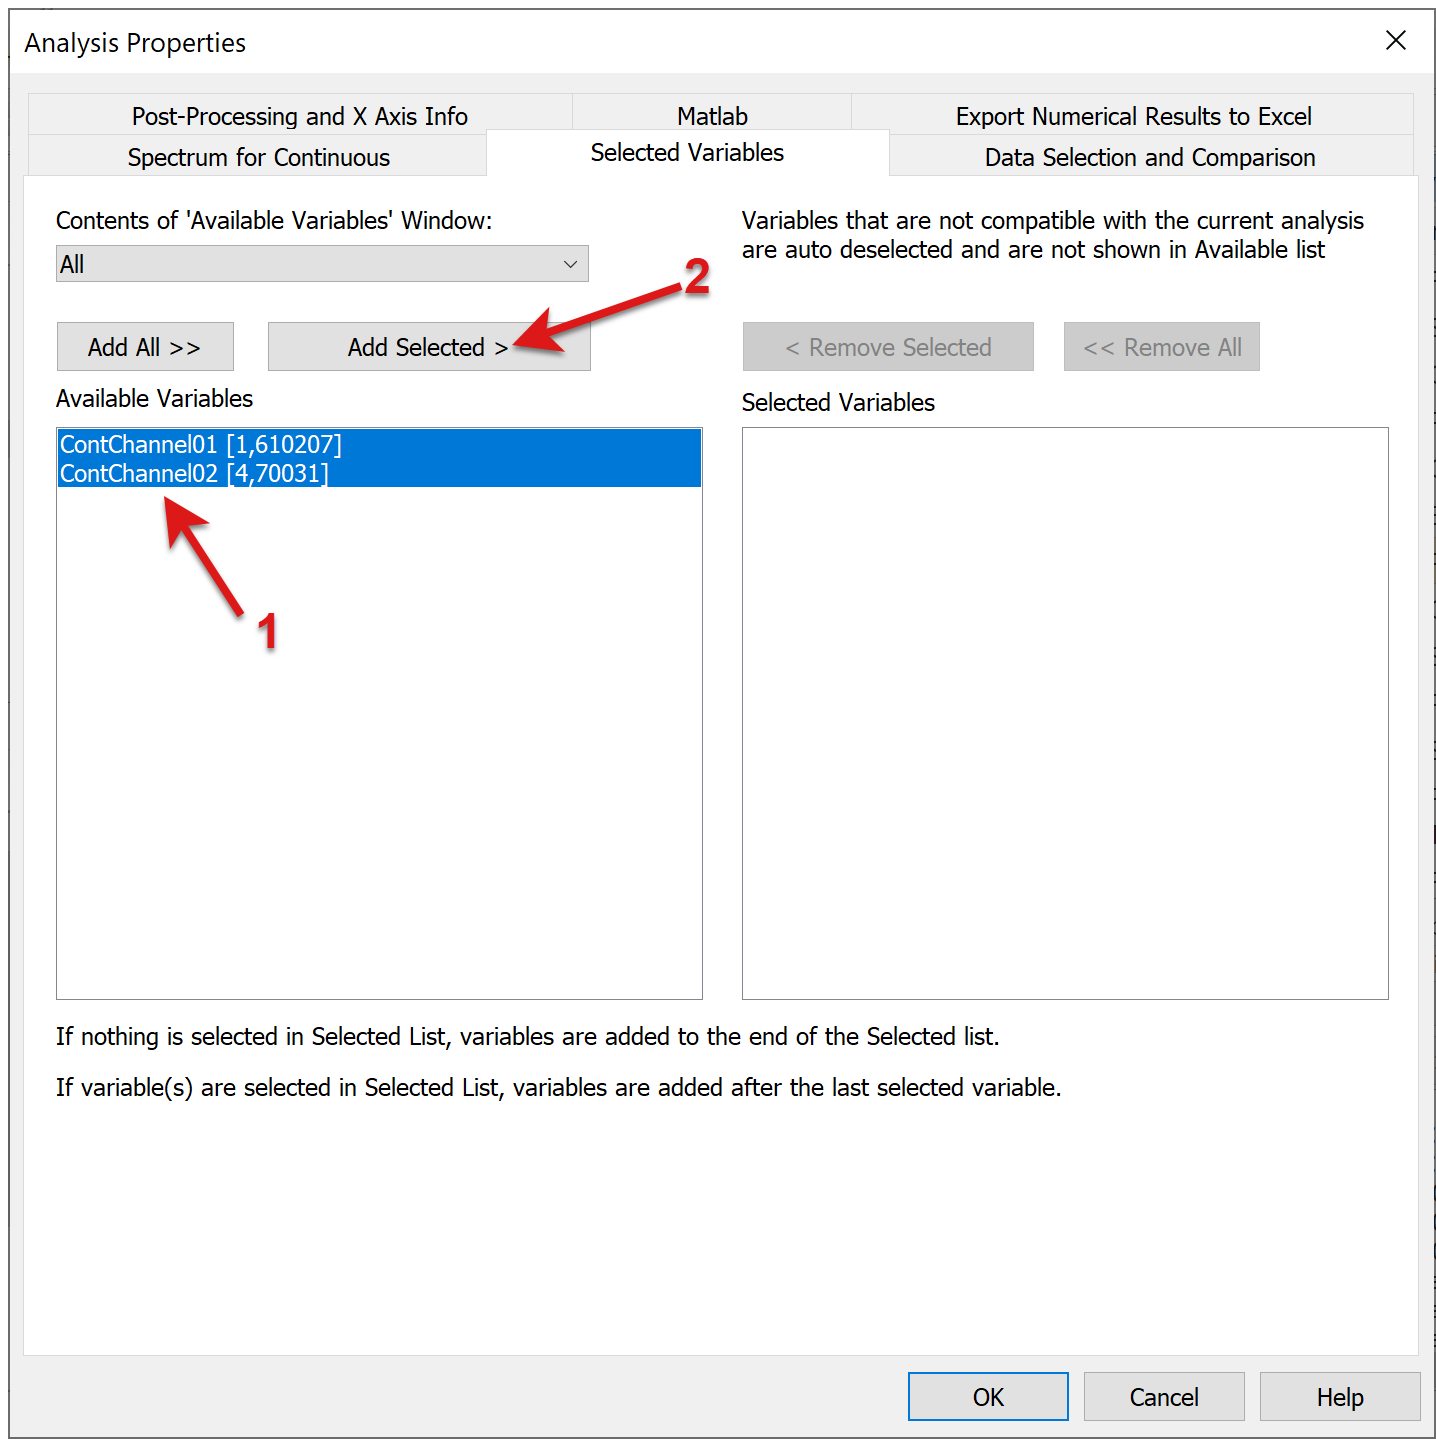
Select the continuous variables that you want to be analyzed in the left variables list (use Ctrl+Click to select multiple variables) and press Add Selected > button:
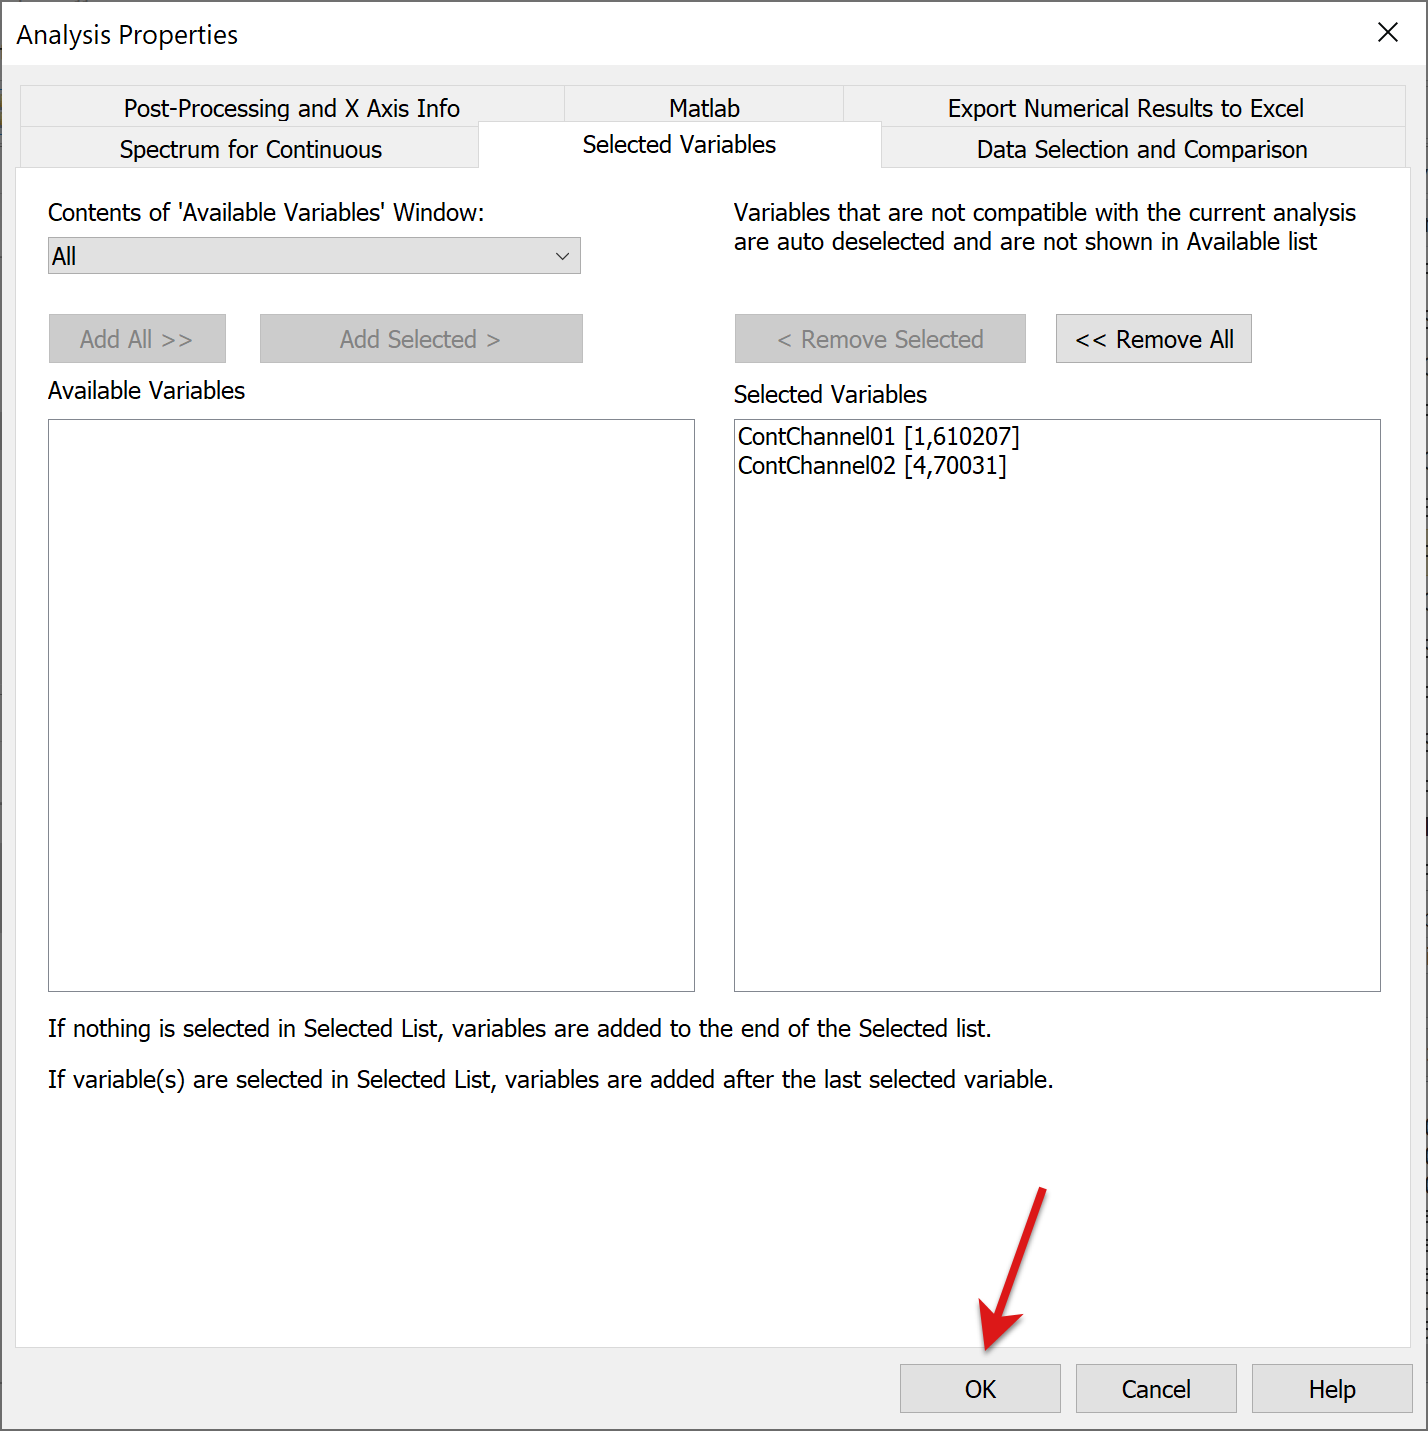
Press OK in the Analysis Properties dialog
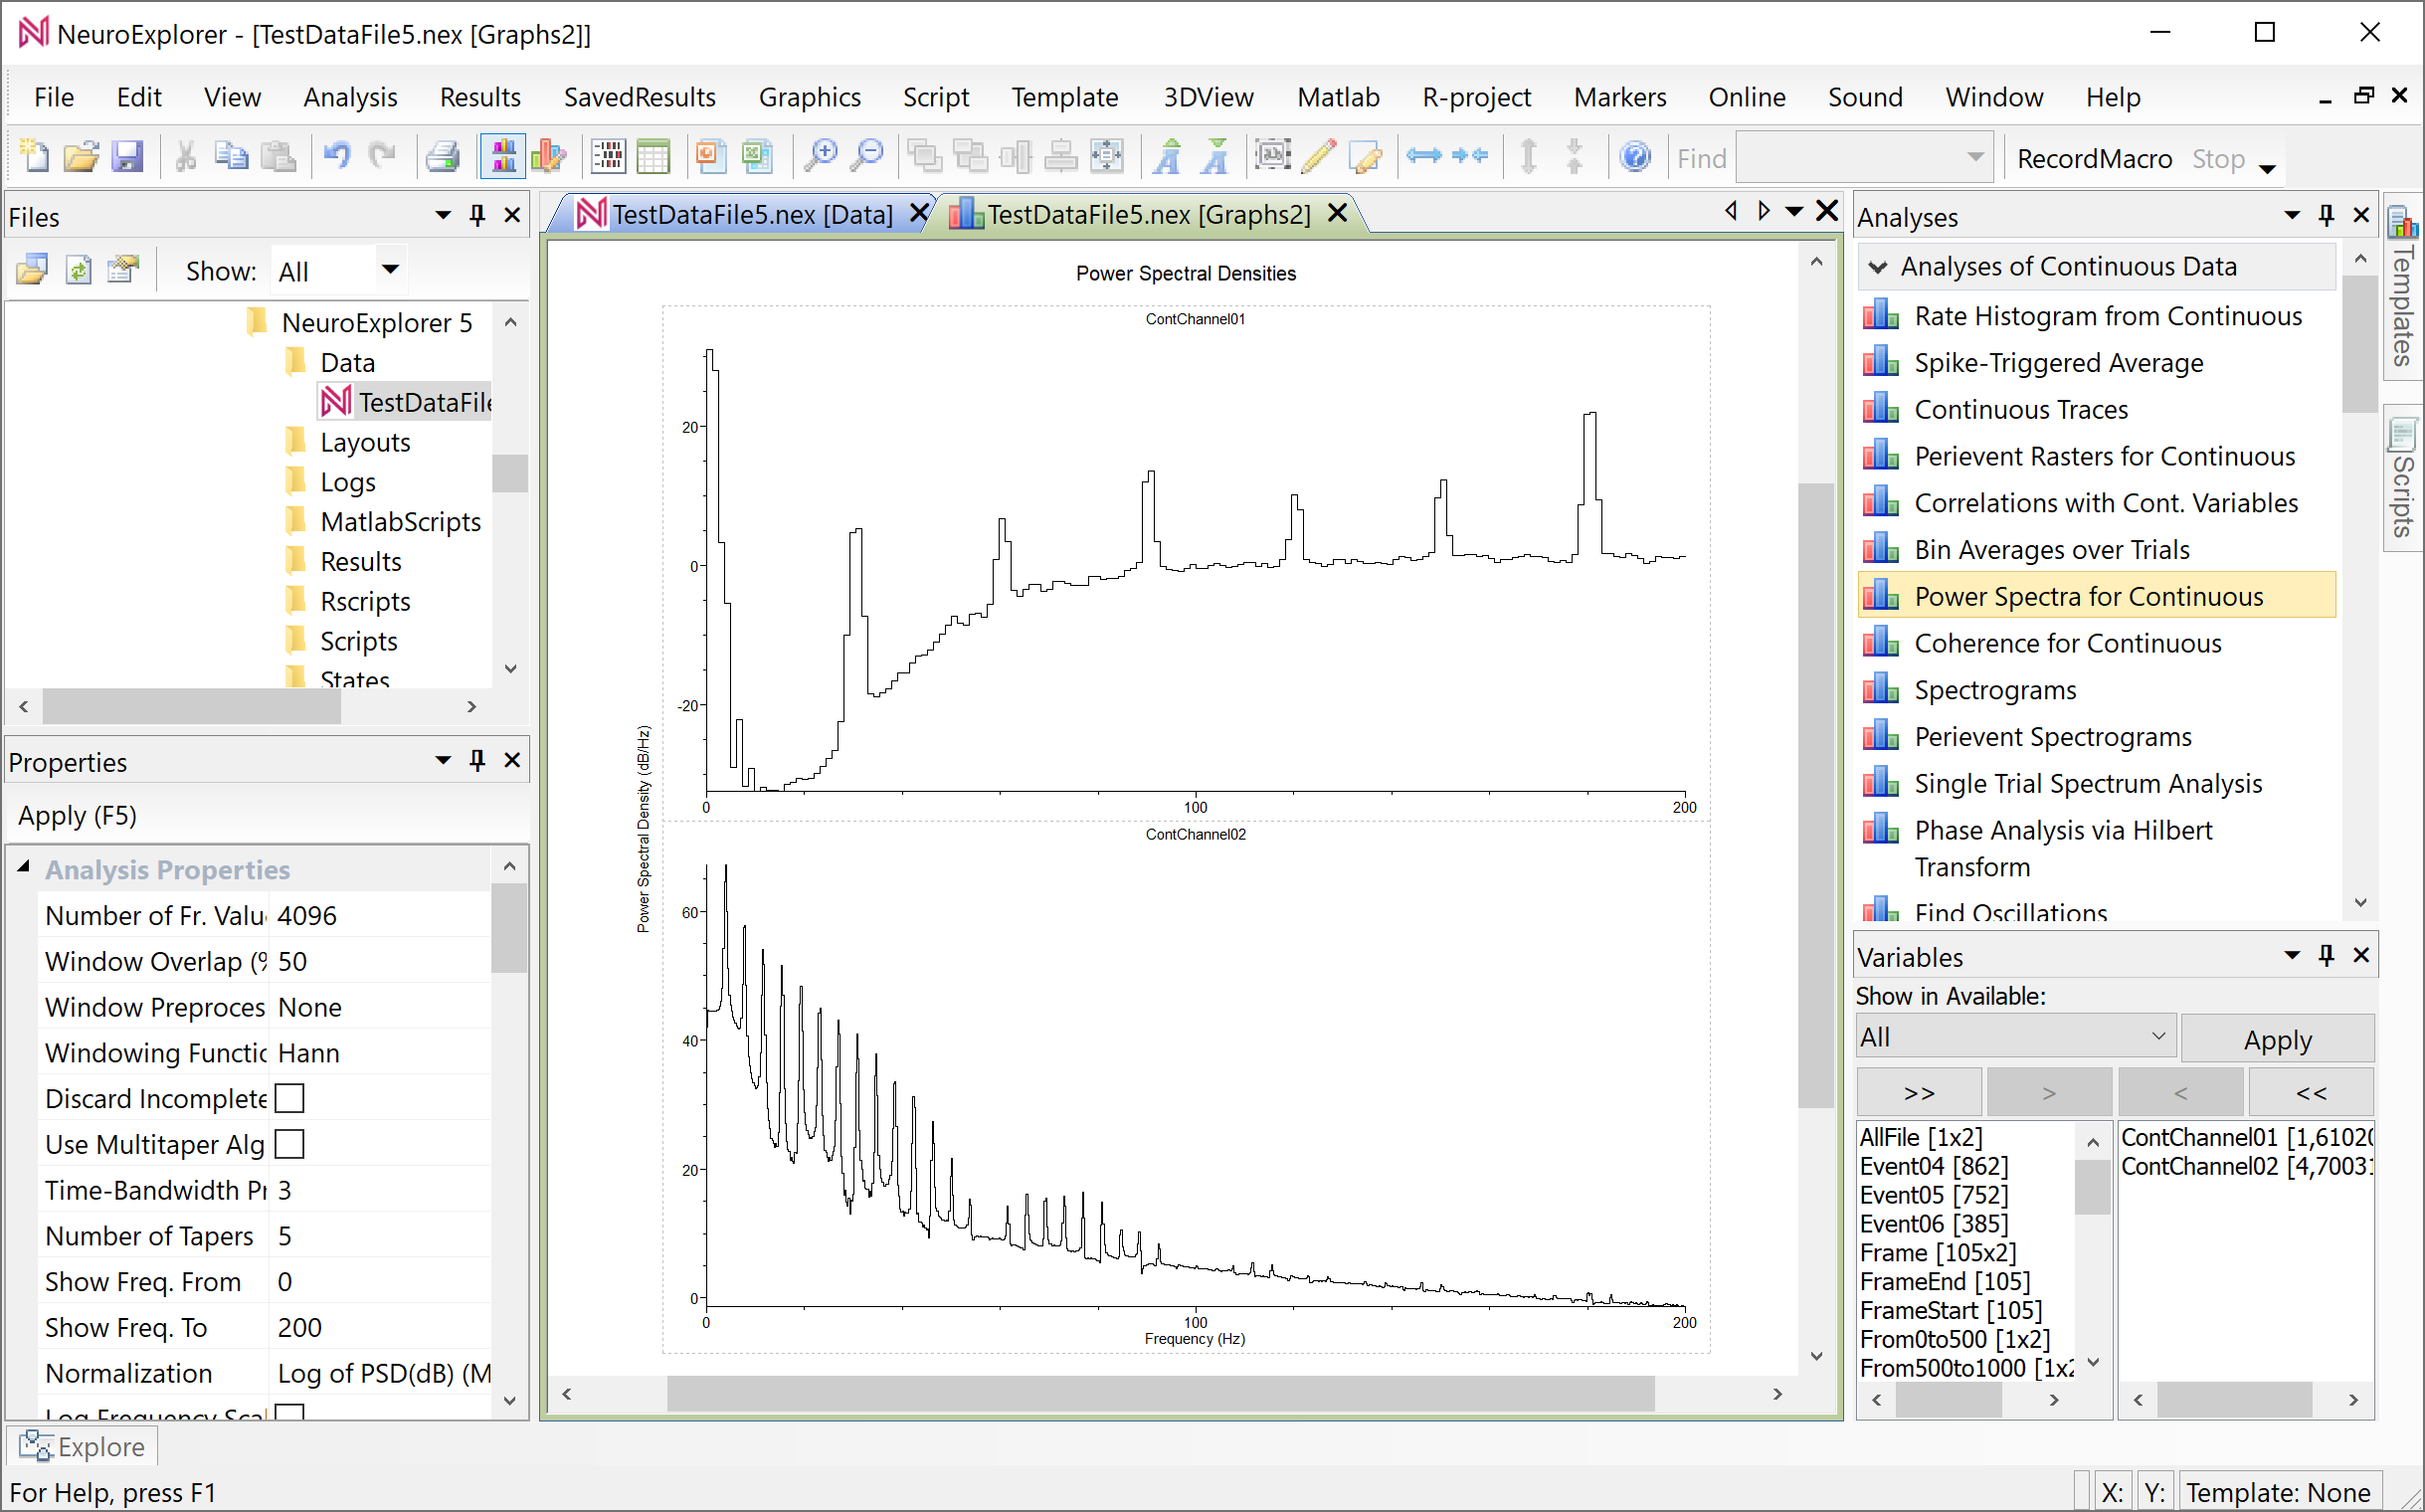
NeuroExplorer will calculate the spectra of selected continuous variables and will open a new window with graphical analysis results:
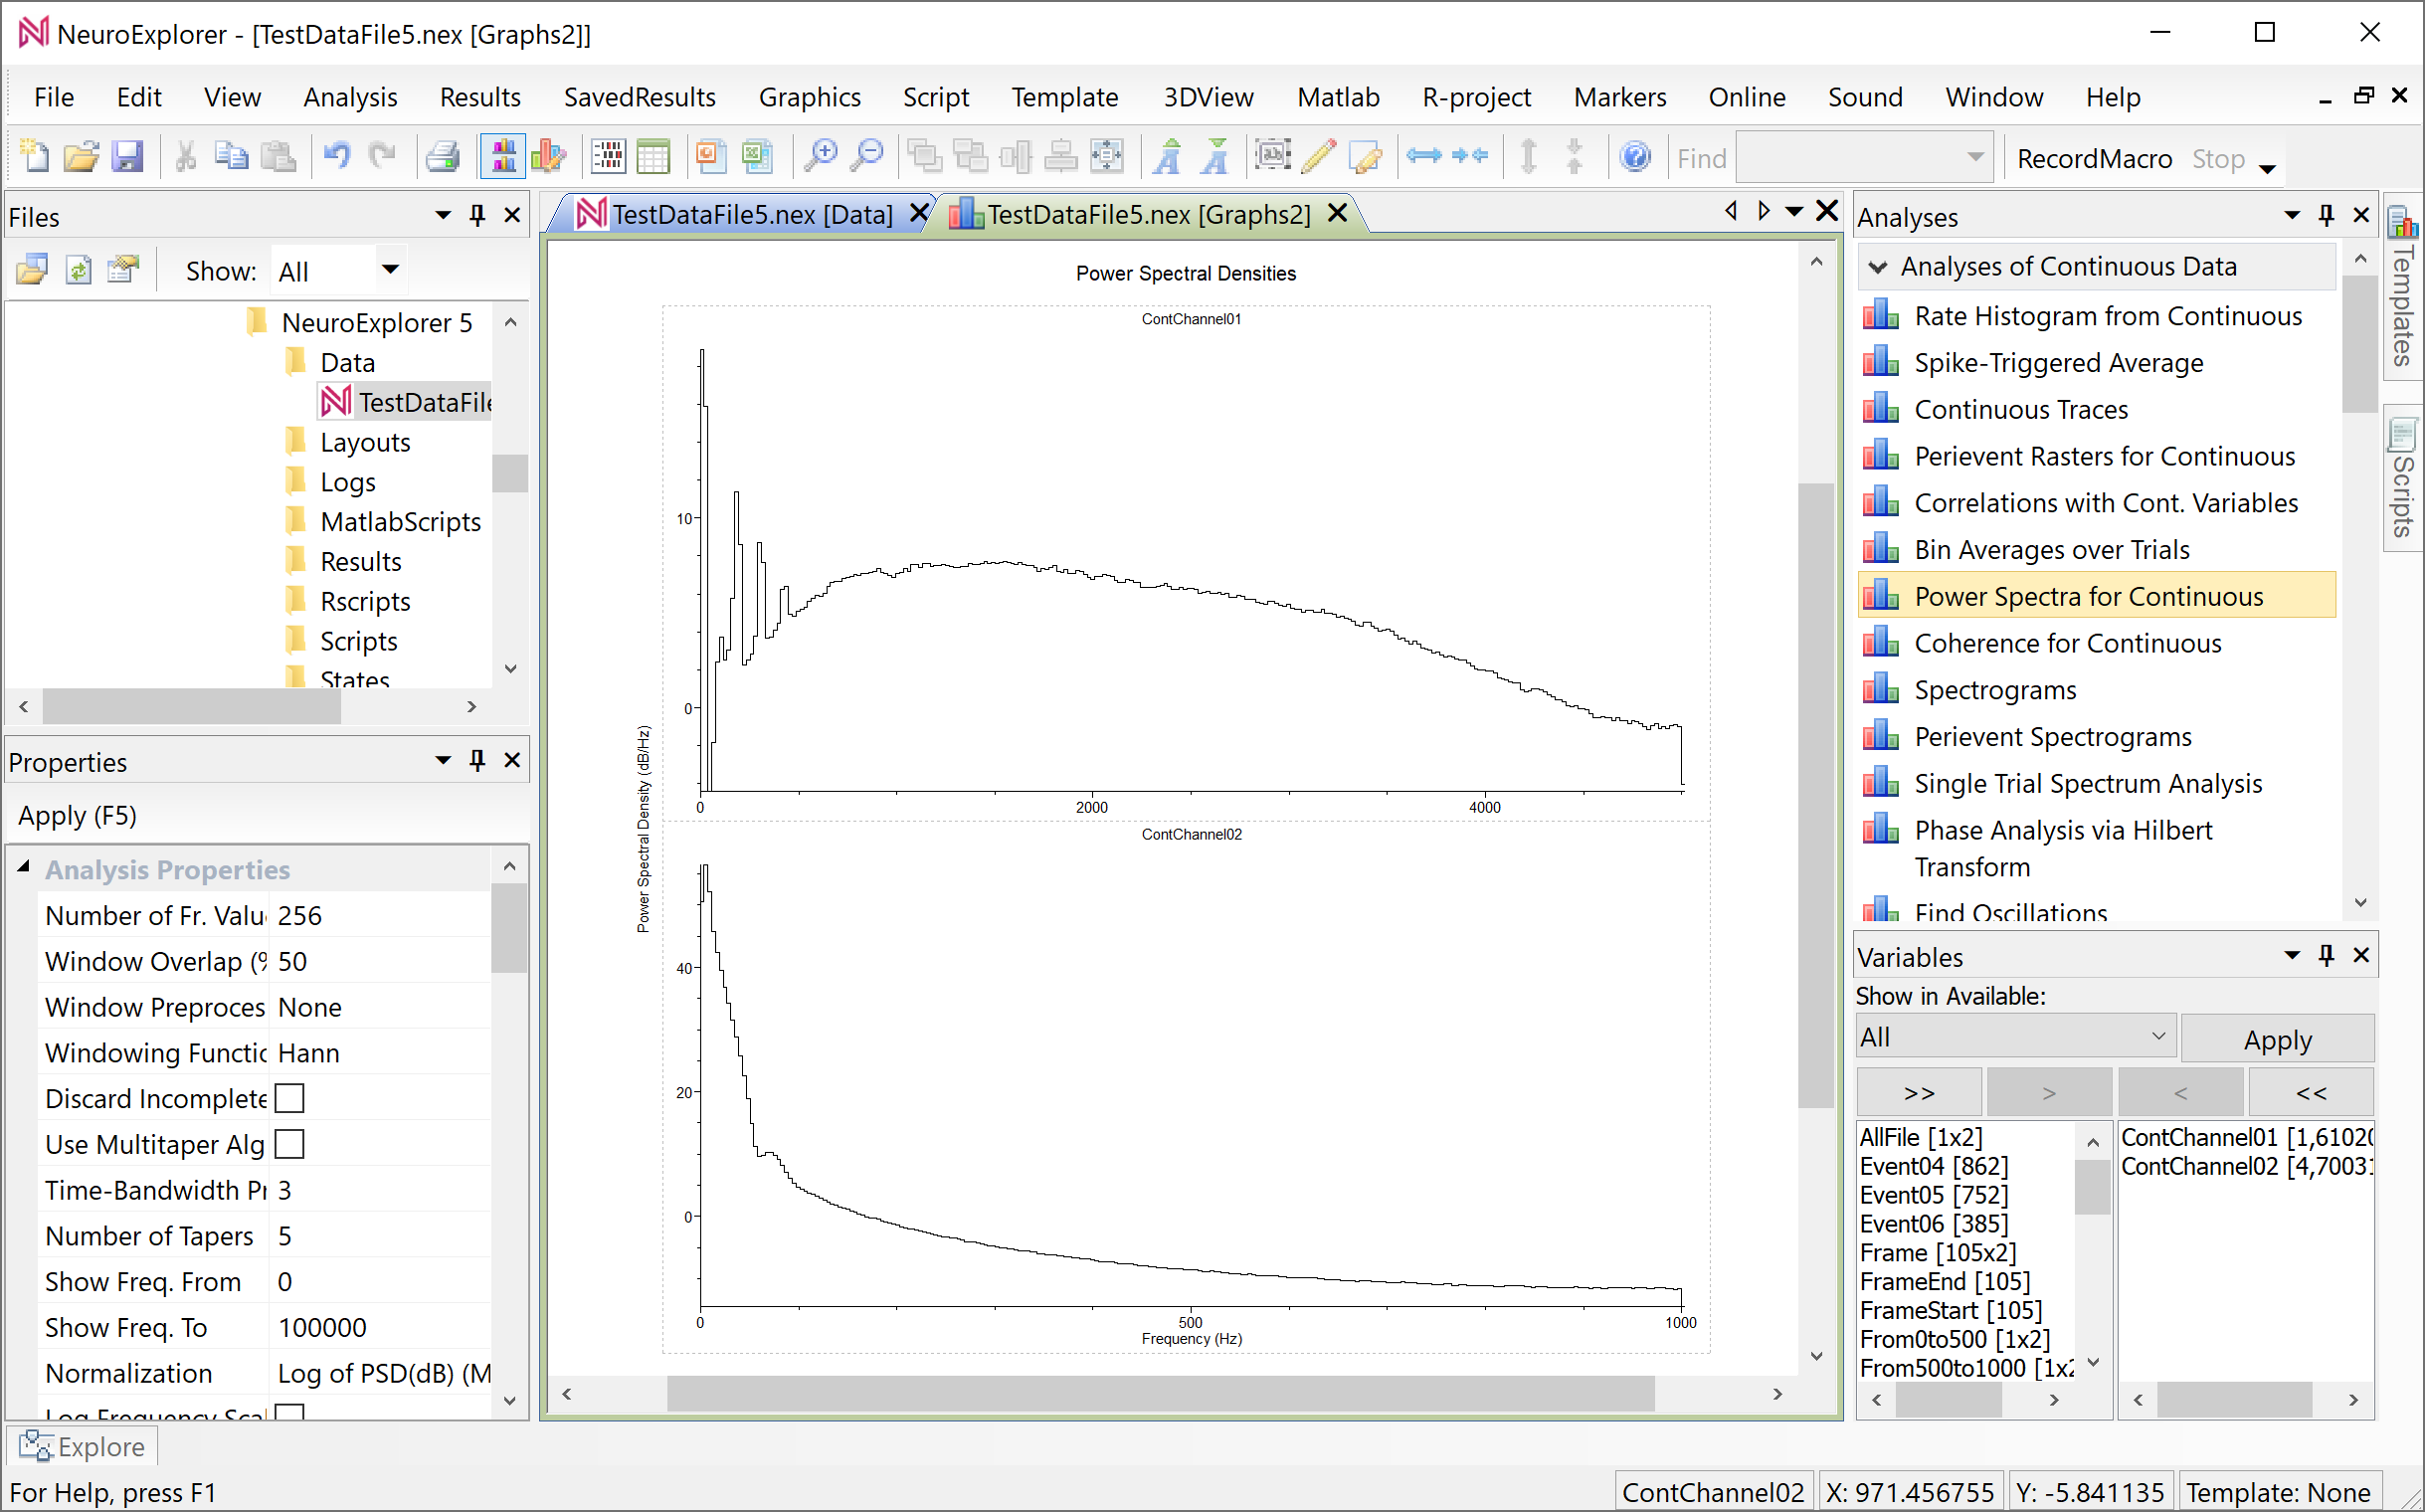
To zoom in the low frequency values of the spectra, double-click inside any of the graphs in the new window. NeuroExplorer will open Analysis Properties dialog.
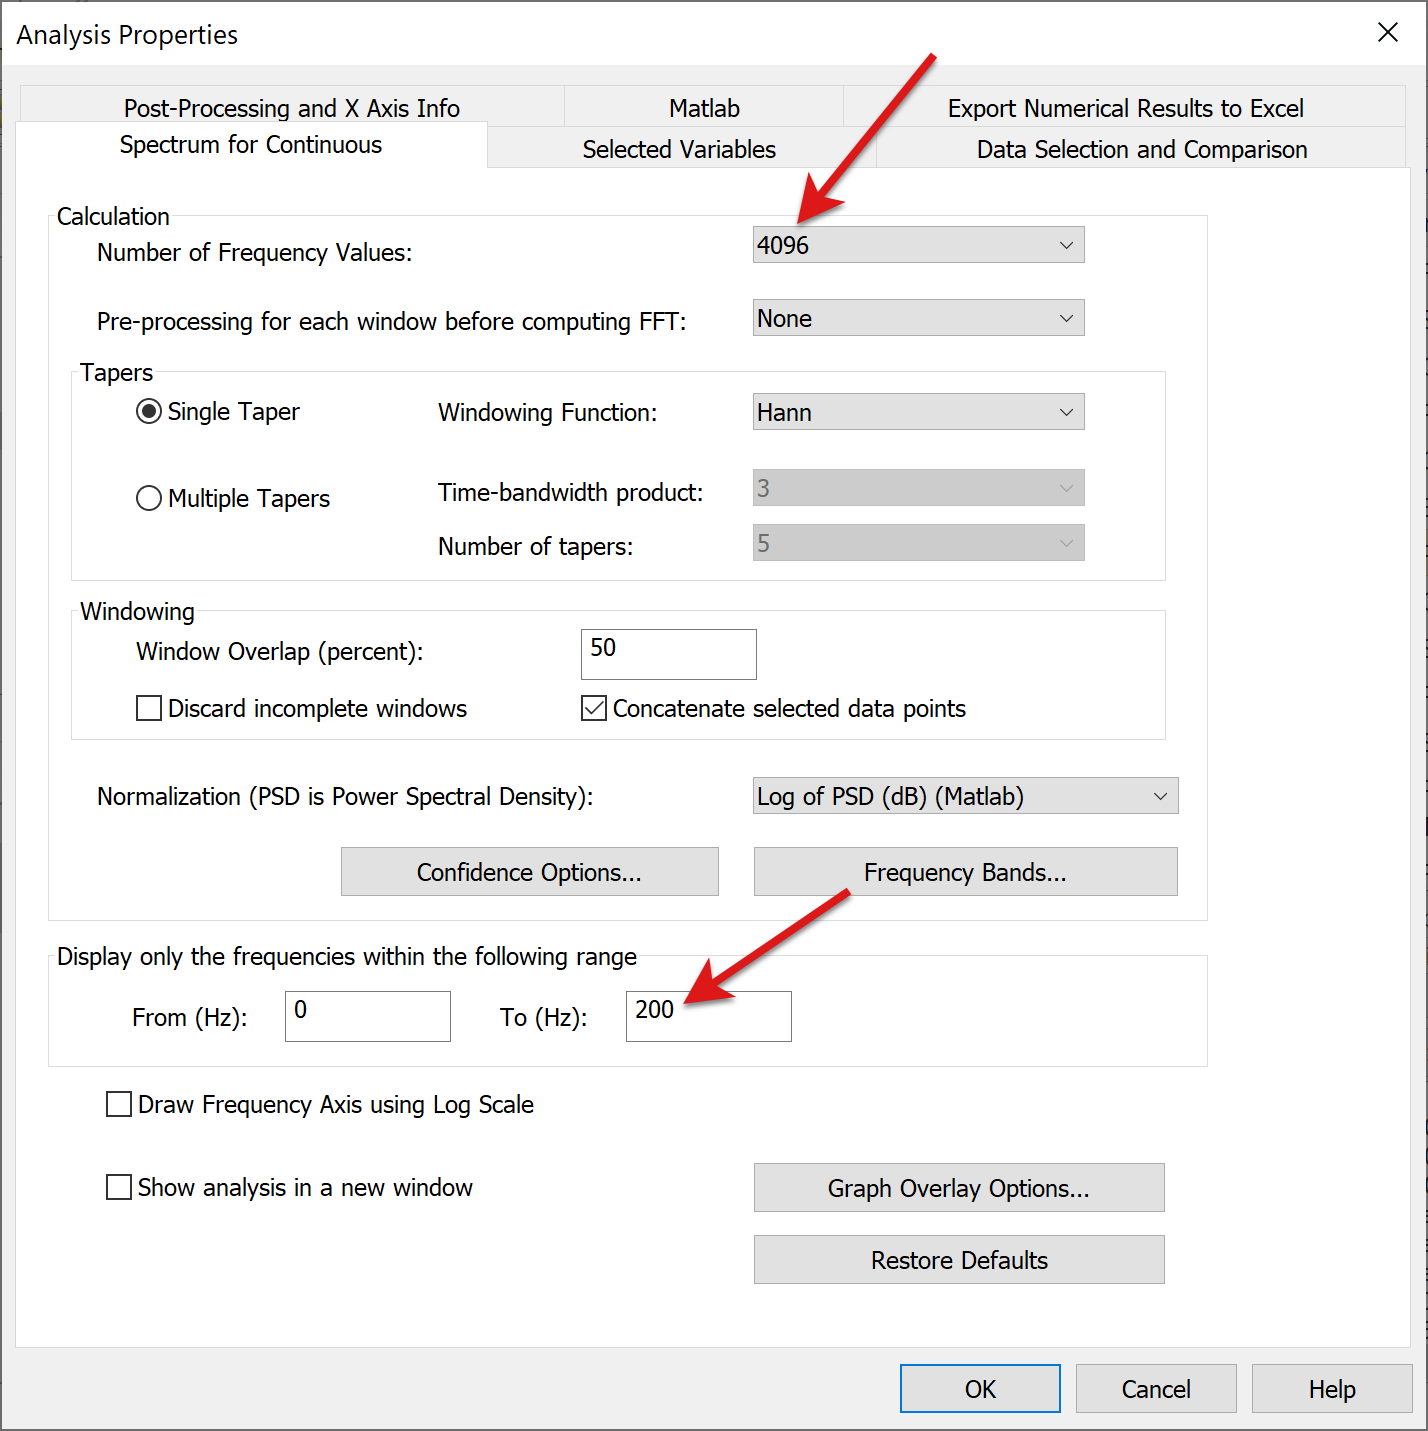
Change two analysis parameters in the dialog: set Number of Frequency Values to 4096, change Display Frequency To to 200 and press OK:
NeuroExplorer will show results of the analysis with the new parameters: